Digplot
Digplot is a simple program to extract data values from images of 2-D plots.
Using Digplot
Loading an image
You can load an image by:
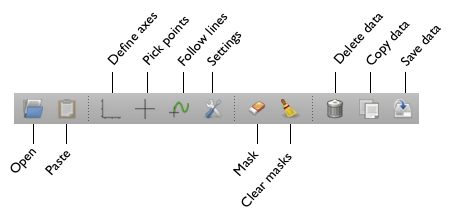
- Opening an image file using Open Image
- Pasting an image from the clipboard with Paste Image
- Dragging and image file into the window.
PNG, JPG, GIF, BMP, TIFF files (and others) are supported.
Moving and selecting points
To move the cursor using the keyboard, use the arrow keys to move by 1 pixel. Home/End/PgUp/PgDown move by 10 pixels. Holding down Shift and pressing the arrow keys moves by sub-pixel amounts (1/10 pixel) for better accuracy on low-resolution images.
To select a point, click on the plot or press Space.
Defining axes
Choose Define Axes and select any three or more points with known X and Y, then press Enter.
Tools ‣ Log X Axis or Tools ‣ Log Y Axis let you choose between linear and log scales.
Digitizing points
Select the Pick Points tool to start digitizing points.
Click on the plot or press Space to digitize a point. A blue marker will appear and the x and y values will be added to the table.
Digitizing lines
Select the Follow Lines tool to start digitizing lines.
When you move the mouse over a line that can be followed, a green line will appear. Click or press Space to digitize the line.
In the Settings dialog you can set the parameters for the line following algorithm:
- curve color and background color: a pixel is considered part of the curve if its color is >25% more similar to the curve color than the background color.
- horizontal gap and vertical gap: the dimensions of a rectangle which is searched for the next point along the curve.
- follow direction: can be right, left, up or down.
Masks
Using the Mask tool you can direct the line following algorithm in difficult areas, for example where the curve intersects other curves or axes. Any areas you mark will be considered to not be part of the curve regardless of their color.
You can change the brush size using the + and - keys.
To clear all masked areas select Clear Masks
Editing data
You can change digitized X and Y values by editing the values in the table. You can also select data points (table rows) and delete them using Delete Selected or the Del key.
Select Delete data to clear all the digitized data.
Saving or copying data
When you are done, you can save all digitized X and Y values to an ASCII file using Save data or copy them to the clipboard using Copy data.
