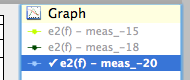
Mark the curve you want to fit. To do this, double click the curve on the plot or in the legend, or select it and choose Edit ‣ Mark or press M.
To control which points are used in the fit, use the Range tool and/or masks. Only the visible points on the curve are fit.
You can change the dataset or the range of points being fit at any time.
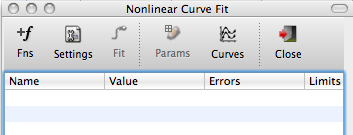
Open the fit window
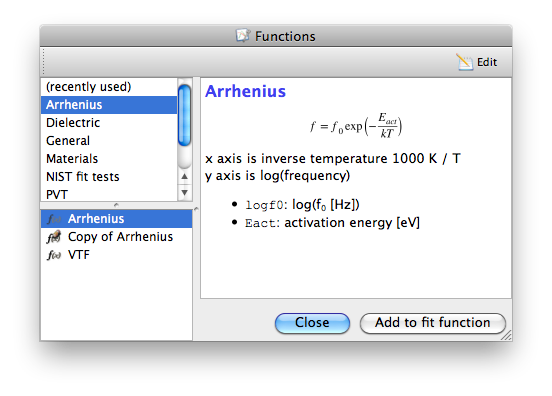
Click Fns to open the Functions dialog, and add one or more terms to your fit.
To remove a term from the fit, press Del or right click the term’s name and select Delete from the context menu.
To disable/enable a term without deleting it you can collapse/expand the term in the list by clicking on the triangle next to the term name or double clicking the term name.
Click Settings to open the Fit Settings dialog, and add one or more terms to your fit.


 where
where  is the error bar of the dataset
 for two successive iterations is less than the -tolerance
You can control where to save the fit results when the fit is finished: give a worksheet name for the fit parameters and a notebook name for the fit report. Errors in the fit parameters can optionally also be saved in the worksheet.
In the fit results worksheet, a column is created for each fit parameter. Each time you choose to save fit results, a new line is added with the current values of the fit parameters. You can set additional data to be saved in the worksheet by putting a list of comma-separated names in the Extra Columns box (for example “temp, pres”).
You can set the values of the fit parameters by editing the Value column in the fit window. For certain fit functions, parameter values can also be changed by dragging the fit curve with the mouse.
Choosing Reset from the term’s context menu will revert all parameters to their default value.
Click Fit to run the fit. The bottom of the fit window will show the progress of the fit.
Click Params to save the current parameters to a worksheet (the worksheet name is specified in the settings).
Click Curves to add the fit curves to the plot. The data is stored in a worksheet called <graphname>_curves.
To add only a single term to the graph, choose Add term to graph from the term’s context menu.
Choose Fit ‣ Create report to save a text summary of the fit to a notebook window.
You can fix the value of a parameter by right clicking the parameter name and choosing Lock from the context menu. Choosing Limits lets you set minimum and maximum values; Reset Limits will restore the limits to their default values.
It’s also possible to fit multiple datasets simultaneously. If you mark multiple datasets, they will appear in a list near the bottom of the fit window.
By default all parameters are shared among all datasets. When you select Split from a parameter’s context menu, its name turns blue indicating that the parameter is no longer shared and can take a different value for each dataset. The parameters shown in the fit window, and the curves on the graph, correspond to the dataset which is currently selected in the list at the bottom of the fit window.