To import files, select File ‣ Import or drag files onto the grafity window. If grafity recognizes the file format it will be imported in new worksheet(s). File formats that are recognized currently are
- ASCII text files
- Grafity projects from all old versions of grafity
- GNOMIX PVT data (import the .RIF file)
- Data from IMASS TDS dielectric spectrometer (.TDS)
- TA thermal analysis files (limited support)
- [.TXT files from NRL software for dielectric spectroscopy]
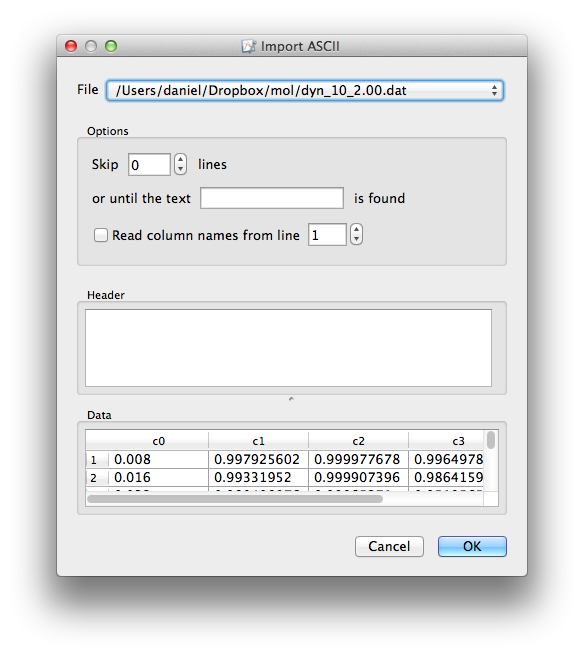
For ASCII files, the Import ASCII dialog will open, which allows you to control the way data is imported.
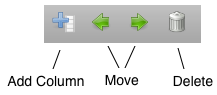
To add a column at the end of the worksheet, choose Add Column. Holding Shift will insert the new column before the selected one.
To remove columns, select them (by clicking on their titles) and click “Delete” on the toolbar or press Shift+Del.
Double click the name of the column to rename. Pressing Tab while editing the name will move to the next column.
To move a column, drag its title to the new position.
You can enter data directly into worksheet cells using the keyboard. You can enter numbers (for example 1.5 or 1.15e-2), expressions (2*12, sin(pi/8), [1,2,3], actually any Python expression that can be converted to a number or a 1-d array). In expressions you can use constants (pi, e) and some functions from numpy and scipy, and do calculations with the values of other columns in the same worksheet (sin(a)+1).
See http://docs.scipy.org for more information about numpy and scipy.
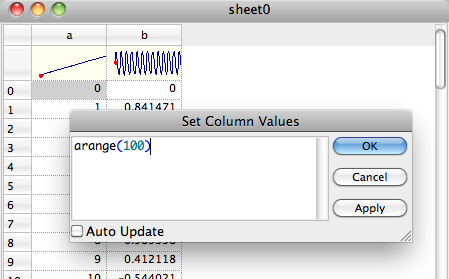
For setting the entire column, it is more convenient to use the “Set Values” window. Right-click the column name and select “Set Values”, or just press Space. The Set Values window will remember the last expression entered for the column. It also gives the option to automatically update the calculation when the columns that it depends on change.
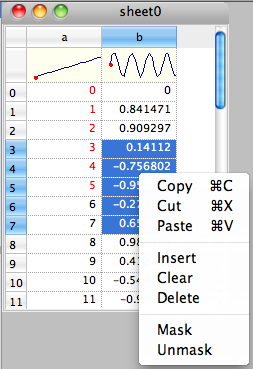
In a worksheet you are able to mask data. Masked data appear red in worksheets. They will not appear in plots or be used in fitting.
To mask or unmask data, select it and choose Mask or Unmask from the context menu. To unmask all data in a column, right click the column name and select Unmask All from the menu.