
Various operations can be applied to curves in a graph. By default operations are applied only in the graph, not to the worksheet data. These include:
- Translate and scale
- Move and delete data points
- Derivative, integral
- Smooth, denoise
- Interpolation/extrapolation
- Add, subtract, multiply, etc. with another curve
- Other calculations (manual)
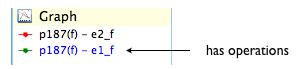
Curves that have operations appear blue in the legend:
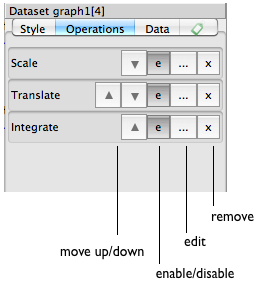
A list of all the operations applied to the selected curves appears in the properties window of the curve under the Operations tab. Operations can be individually enabled/disabled, moved, removed or edited.
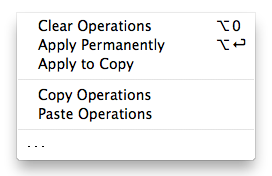
Use Operations ‣ Apply Permanently to apply the operations to the worksheet data. Operations ‣ Apply to Copy makes a copy of the curve and applies the operations to it, removing them from the original curve. Operations can also be copied and pasted between curves.
Shift horizontally and/or vertically (add a constant).
Scale horizontally and/or vertically (multiply by a constant).
Three methods are available:
Calculate derivative using Savitzky-Golay smoothing (see below).
derivative: order of the derivative to calculate
points: number of points to use on either side of the data point
order: Order of the polynomial used, usually leave this at 3
Two methods are available:
Calculate integral of a spline fitted to the data.
order: polynomial order of the spline
Four smoothing methods are available:
Four interpolation methods are available: linear, splines, B-splines and PCHIP.
For extrapolation, you also have the choice to use data from another dataset or from the current fit function.
Add, subtract, multiply or divide with another curve.
Enter expressions to apply manual calculations to the x and y values of the curve.
Drag data points to move, double click to remove.
